When the digital revolution came to photography it brought with it a plethora of advantages for photographers: making vast quantities of images with no increase in cost; seeing the photo immediately after you make it; changing ISO with each shot; and the advent of the digital darkroom; to name a few.
One of the most important benefits of digital photography is one that can be a little intimidating for new photographers – the histogram. But there’s no reason to shy away from it – it’s actually pretty easy to use once you understand how it works. The histogram is simply a graphical representation of the tonal range of your photo that helps you evaluate the exposure.
Before digital photography, we had to wait until we developed the film to know for sure whether we got a good exposure when we made an image. Now, by using the histogram, this information is at your fingertips before you take the shot (in cameras with Electronic Viewfinders), after you take the shot, and during post-processing as well.
How to Read Your Histogram
It’s easy: the blacks are on the left, the whites are on the right, all the mid-tones are in between.
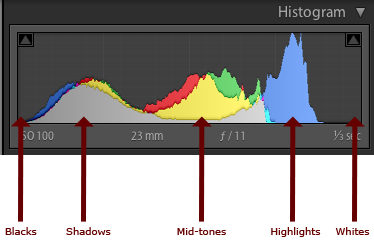
The most important thing to know about the histogram is that a spike on the right, that touches the edge of the graph, is a problem. That means that there is a portion of your image where the highlights are “blown out”, or completely white with no detail. The reason this is such a big problem is that an area that is blown out contains no data at all, so you will not be able to do anything in post-processing to adjust it. This only applies if the spike touches the edge of the graph. If it spikes before the edge, that’s okay.
If there is a spike on the left edge, it means part of your image is completely black. You may want to use your exposure compensation to adjust the exposure to the right to make it brighter. But remember that having part of your image completely black, especially for a night shot, is okay.
There is no such thing as a perfect histogram. It’s just a graphical representation of the tonal range in your image. It’s up to you, as the artist, to decide what to do with this information. Having solid blacks and bright tones (provided they are not blown out) is not necessarily a bad thing.
Let’s take a look at some examples of how histograms will look for different types of images.
Histogram Examples
High Key Scene
When you have a scene that is high key, it has a lot of bright tones, and not so many mid-tones or blacks. When you are photographing a scene that you want to be high key, your histogram should be stacked up on the right side – but not going up the right edge. If you want your scene to be high key, but your histogram is showing a lot of mid-tones, your whites are probably going to come out looking more gray than you would like.

A high key or light toned scene
Histogram for the image above showing mostly light tones
Low Key Scene
A low key scene is one that is dark, which you would expect when photographing at night. In this case, your histogram will be stacked up on the left side. You may have a spike on the left edge, which indicates solid blacks.
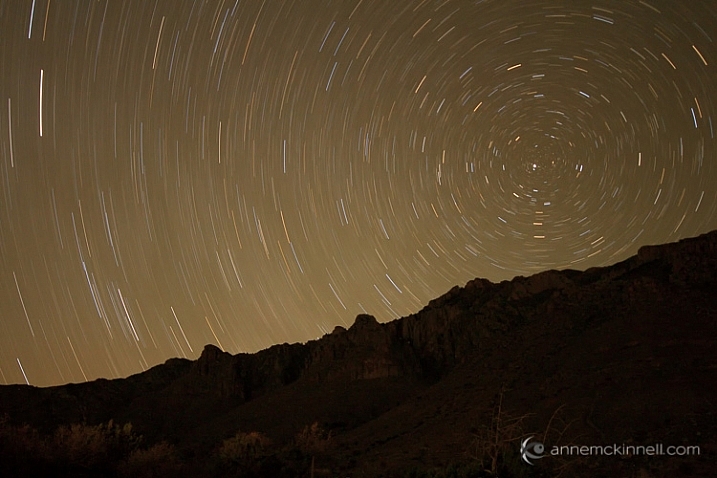
A low key or dark scene will have mostly tones on the left side of the histogram.
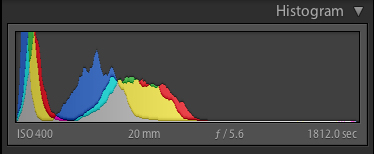
Histogram for the image above showing a dark scene.
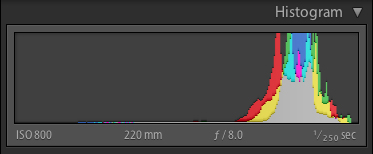
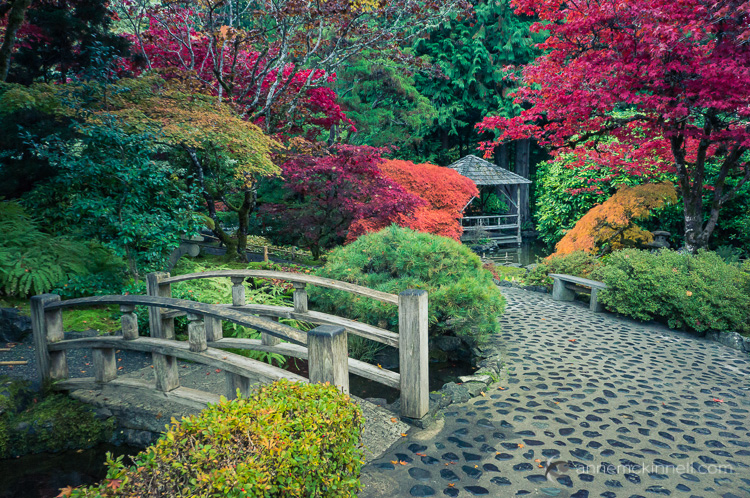
High Contrast Scene
A high contrast scene is one where there are lots of very dark, and very bright tones, and perhaps not so many tones in between. In this case, your histogram will show data on the left and right, and not so much in the middle.

High contrast scene. Extreme brights and extreme darks with little in the middle.
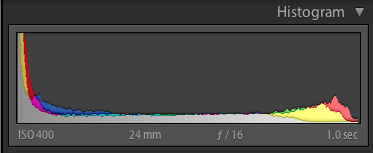
Histogram of high contrast scene above.
Low Contrast Scene
A low contrast scene has a lot of mid-tones, and few and bright tones. Your histogram will have a bell shape.
Again, it’s up to you as the artist to choose what to do with this information. You have to decide whether the information in the graph is what you want or not. It’s just another tool in your arsenal, to help you transform your artistic vision into a photograph.
If you’re not happy with your histogram, use your exposure compensation to adjust the exposure by making the image darker or lighter. Or, you may choose to affect the light on the scene instead by using a flash, a reflector, or a diffuser. The choice is yours.
Understanding the Colour Histogram
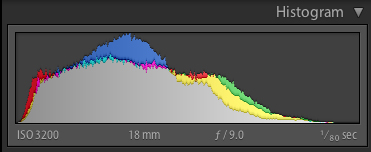
You’ve probably noticed in the examples above that the histogram not only shows the tones in grayscale, but it also shows you colours. Yes, it’s possible to blow out a colour! If there is one particular colour that is very bright in the scene, sometimes that colour will become so saturated that you loose detail. This commonly happens with red flowers for example.
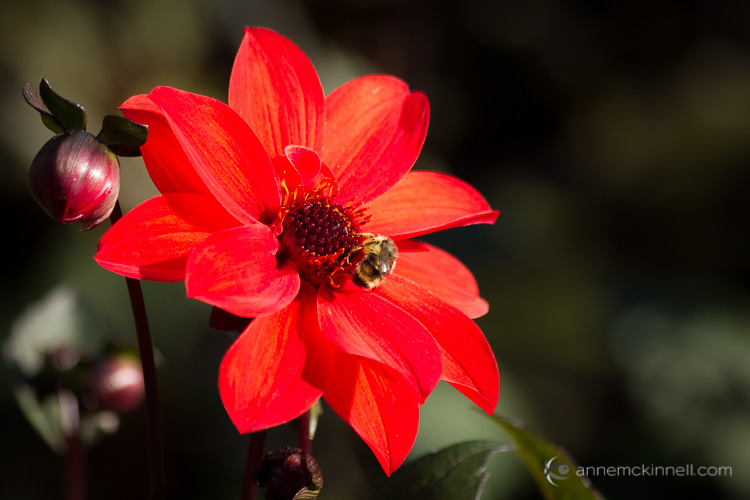
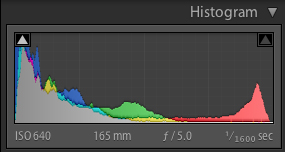
To combat this, you can slightly desaturate the colour in post processing to bring back some of the detail in the flower petals. The histogram above shows the increase in red tones towards the brighter end of the scale.
When to use the Histogram
In the field, you can use the histogram in conjunction with Live View to see it before you make an image (or turn it on if you have a camera with an Electronic Viewfinder like many mirrorless models offer). You can also see it afterwards when you review the photo on your LCD screen. Either way, it’s critical that you use the histogram to check your exposure while you’re in the field. That way you have an opportunity to make another exposure while you are still on scene.
Don’t rely on your LCD to give you feedback about exposure. It’s great for checking composition and focus, but not exposure. That’s because the brightness of your LCD has nothing to do with the brightness of your image, since you can adjust the brightness of your LCD. For example, you can brighten it so you can see it more easily outside on a sunny day. But then if you don’t change the brightness back again and you look at it at night your images are going to appear super bright, when they actually are not.
The histogram is also available to you while post-processing your image. Use it to see where adjustments need to be made and to ensure that you don’t create areas that are too bright or too dark while processing your images.
I hope that gives you a better understanding of how to use this handy tool. If you have any questions about histograms please put them in the comments below.
The post Histograms for Beginners by Anne McKinnell appeared first on Digital Photography School.