The histogram in Lightroom is a useful tool that is easily overlooked. Its main purpose is to help you understand the relationship between the sliders in the Basic panel and the tones in your photos. It helps you get brightness levels spot on and edit images without losing highlight detail.
Where is the Lightroom histogram?
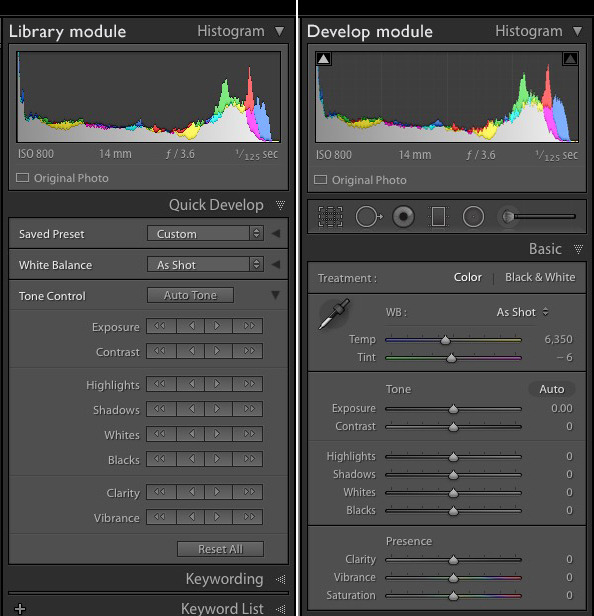
The histogram is found in two places, at the top of the right-hand panels in both the Library and Develop modules. In the Library module, it helps you see what is happening to your image when you make adjustments in the Quick Develop panel. You also need it in the Develop module so you can see how any adjustments you make during post-processing affect the histogram.
What does the LR histogram tell you?
The histogram tells you whether you have any clipped highlights or shadows. It also tells you how much contrast the photo has. This information lets you decide whether you need to adjust exposure and contrast. It also tells you whether the original photo was over or underexposed. The histogram changes as you move sliders around in the Basic panel, so you can immediately see the effect.
Important: Please note that the following features work with the Develop module histogram, but not the Library module histogram.
How to check for clipping
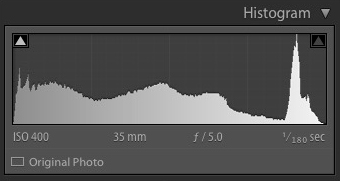
Clipping is indicated by the Show Shadow Clipping and Show Highlight Clipping triangular icons in the top left and right (circled below). Use the keyboard shortcut key J to show and hide clipping.
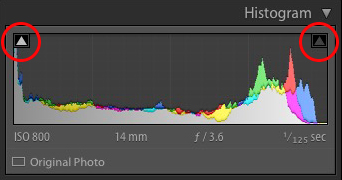
In this histogram, the Show Shadow Clipping icon is colored white to show that the image contains clipped shadows (this is perfectly normal in many images and nothing to worry about).
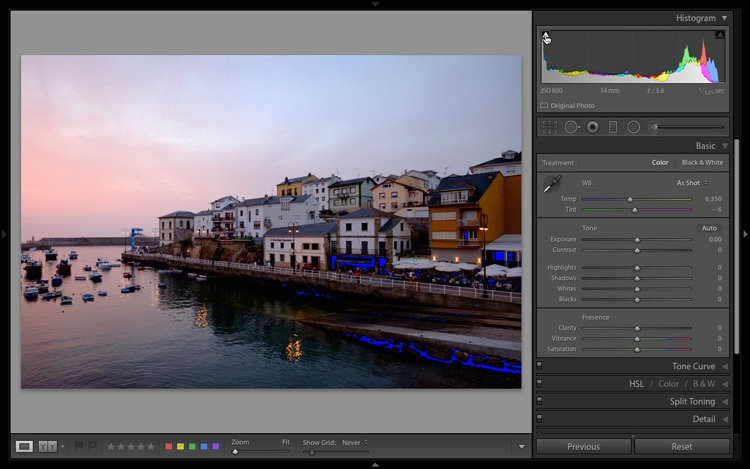
If you click on (or hover over) the Show Shadow Clipping icon, those clipped shadows are shown in blue in the photo.
The Show Highlight Clipping icon on the right is colored gray to indicate that there are no highlights clipping. This is a good sign, as most photographers expose to preserve highlight detail.
The Clipping icons also come in useful to indicate if you are losing detail in the highlights or shadows as a result of making adjustments in the Basic panel.
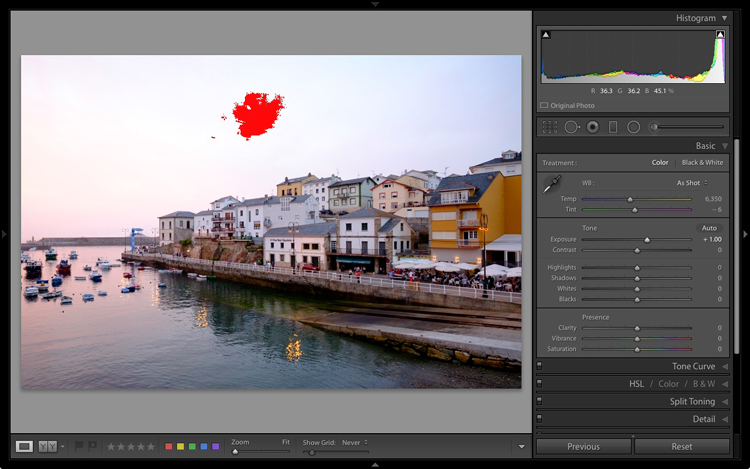
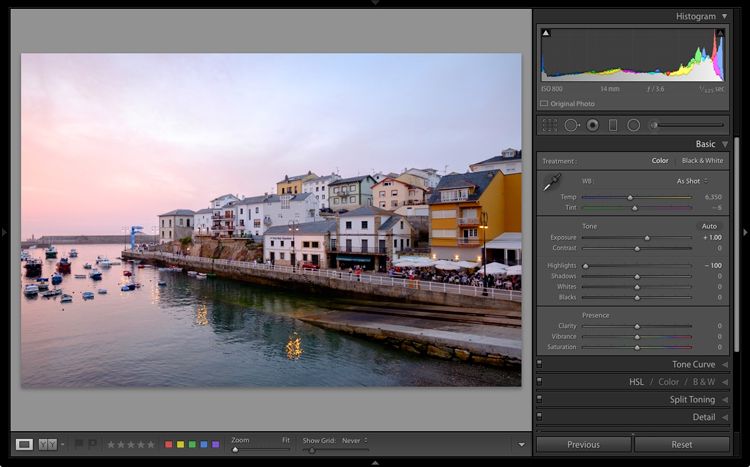
If I set Exposure to +1.00 for this particular image, the histogram tells me that I have lost detail in the sky. The Show Highlight Clipping icon is colored white to indicate this. If you click the icon, clipped highlights are displayed in red in the image. You can see from the screenshot that only a small part of the sky is clipped. This may not be important, but it indicates that perhaps I increased the Exposure too much.
If I set Highlights to -100 the detail comes back in the sky and there is no clipping. Notice how the histogram has changed from above to the one below.
This simple example shows you how you can push sliders around, using the histogram to make sure that you don’t lose highlight or shadow detail.
The histogram and underexposure
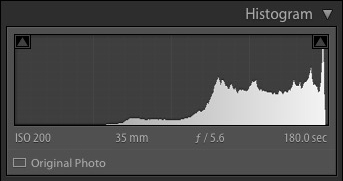
If there is a gap on the right side of the histogram it probably indicates that the image was underexposed (an exception would be if the photo has lots of dark tones but few light ones – like a photo of a black cat sitting on a black rug).
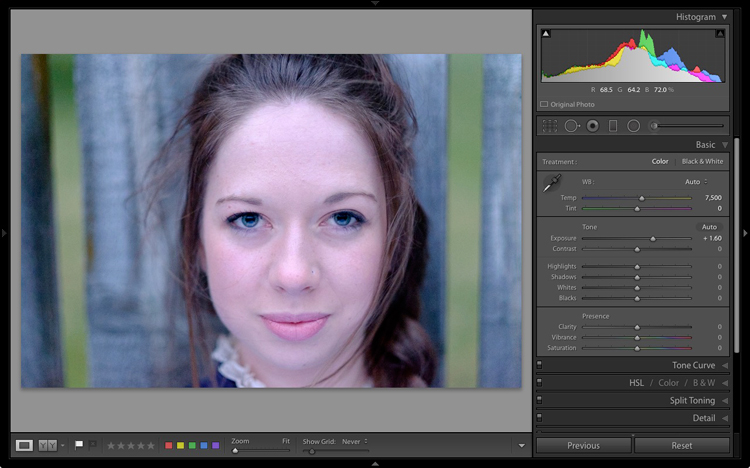
Here’s an extreme example. The photo generating this histogram was underexposed by over a stop.
A look at the photo confirms the histogram is correct and that it is underexposed (too dark).
While it is best to get the exposure right in the first place, you can fix this by moving the Exposure slider to the right. As you do so, the histogram also moves to the right. The Exposure slider is quite clever and increases brightness mostly in the mid-tones to prevent highlight clipping. You may be able to push it a long way to the right without losing any highlight detail.
Here, I set Exposure to +1.6, and the histogram looks much better.
This is what the photo itself looks like after that simple adjustment. Now it is ready for further refinement.
If you see a gap on the right side of the histogram yet the brightness of the photo looks okay to your eye, it could be a sign that the brightness of your monitor is set too high. If this is the case, you will find your photos look dark when printed or viewed on other people’s monitors. Ideally, you want to calibrate your monitor to be the correct brightness.
The histogram and contrast
If the histogram is bunched together and doesn’t cover the entire range of the graph this indicates that the photo has low contrast. This is most likely to happen when shooting in flat light.
Here’s a histogram that demonstrates this.
The histogram belongs to a black and white photo taken on a cloudy day in warm and humid conditions. The spray coming from the sea reduced the contrast of the scene, resulting in a very flat image.
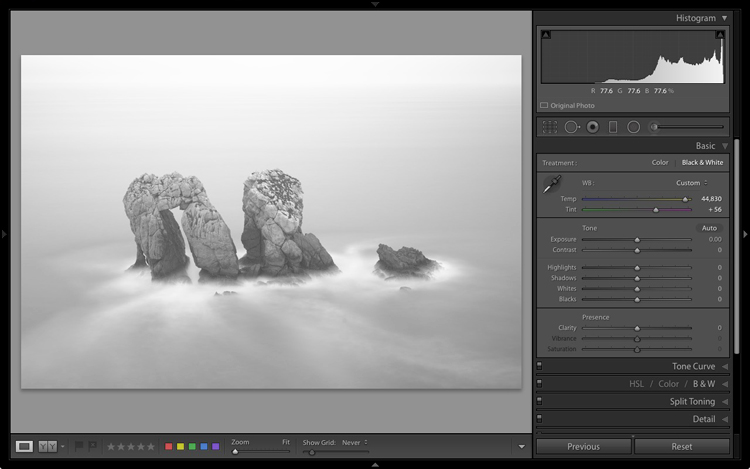
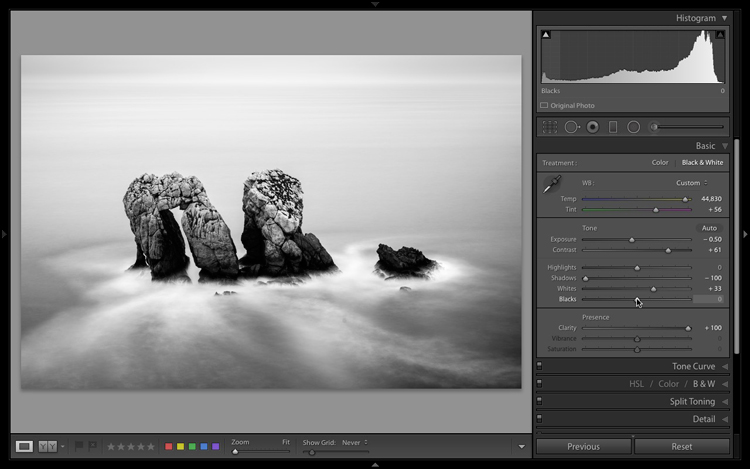
I used the Tone sliders to increase contrast and stretch the histogram so that it filled the space available. The histogram acted as a guide that told me exactly what was wrong with the image and helped me add the contrast back into the photo that it lacked.
The histogram and the Tone sliders
There are five zones in the Lightroom histogram.
When you move the mouse over the Exposure, Highlights, Shadows, Whites or Blacks sliders in the Basic panel the zone that is affected by that slider is shown in light gray in the histogram. I’ve added red lines to make it clear where each zone falls.
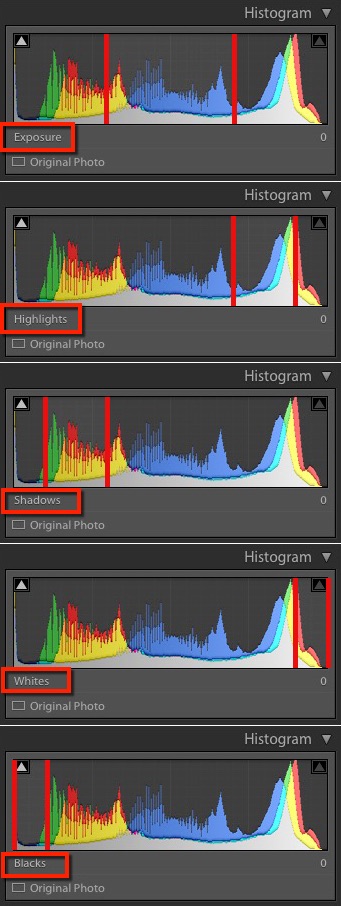
The same zones are shown when you move the mouse over the histogram itself. The name of the slider that controls the tones in that part of the histogram is displayed underneath.
This diagram (right) shows the zone that corresponds to the Shadows slider.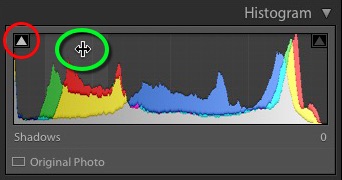
When you see the icon with the two arrows (circled in green), hold the left mouse button down and move side to side to adjust move the Shadows slider left or right. The histogram will change as you do so. This technique gives you control over the Tone sliders from the histogram itself.
Each slider controls a particular zone, but bear in mind that those adjustments also make changes in the other zones. Don’t worry if this sounds complicated – it will make perfect sense once you try it out for yourself. The key is to practice, and you will soon understand the relationship between the Tone sliders and the histogram.
Luminance and color histograms
If you’re processing a color photo you’ll notice part of the histogram is colored. Lightroom is actually showing you four histograms in one. On top is the luminance histogram, shown in gray. This shows brightness values only and has nothing to do with color. This is similar to the luminance histogram on your camera. The other three histograms are colored red, green and blue and correspond to the color channels in the image (some cameras also show these histograms).
You’ll also see some additional colors (like yellow) where the red, green and blue histograms overlap.
Saturation and the histogram
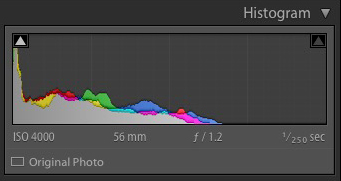
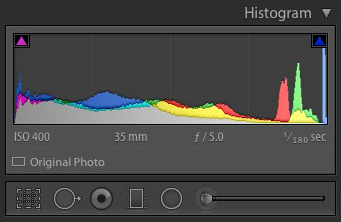
The color controls in the Basic panel affect the color histograms. The easiest way to show you is by demonstrating how the Saturation slider affects the color histograms. Here is a histogram belonging to a color photo, with Saturation set to zero.
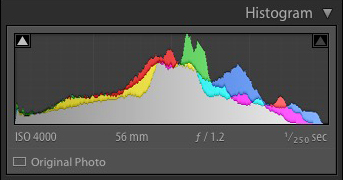
This is what happened when I set Saturation to +100. Increasing Saturation means that the colors are stronger. The result is that the peaks of the color histograms are higher.
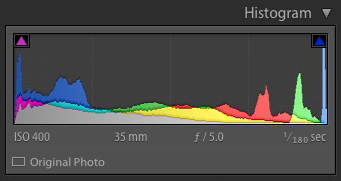
You’ll also notice that the Shadow Clipping icon (on the left) has turned magenta, and that the Highlight Clipping icon (on the right) has turned blue. These indicate that there is clipping in the shadows, but only in magenta hues, and that there is clipping in the highlights, but only in the blue channel.
This is an extreme example because in real life you will never increase Saturation to +100. But there may be times when you make adjustments that clip colors rather than brightness values. It probably doesn’t matter in images viewed on a computer screen, but it may do with images that are printed on paper or reproduced in a book or magazine.
Finally, when I move the Saturation slider to -100, which removes all color from the photo, the color histograms disappear and we are just left with the luminance histogram. This is a useful tip if you would ever like to see the luminance histogram by itself.
Conclusion
That concludes our overview of the histogram in Lightroom. Hopefully, you can see what a useful tool it is for processing photos in Lightroom. If you have any questions about the histogram, please let me know in the comments below.
If you enjoyed this article and woudl like to learn more about Lightroom then please check out my Mastering Lightroom ebooks.
The post How to Understand and Use the Lightroom Histogram by Andrew S. Gibson appeared first on Digital Photography School.